10. rsEEG Measurement
Important
This protocol is being refactored and improved continuously, so documentation and software may not be completely synchronized.
resting state EEG Measurement has been introduced in the BEST Toolbox in order to estimate individual’s EEG Peak Frequency so that the Brain State dependent protocols can be fed with this necessary information of personalizing the measurement to the subject. As an outcome the user obtains various Power spectrum and measures of Signal to Noise Ration (SNR) so that informed decision can be made about the Brain State dependent protocol.
10.1. Parameters Syntax
10.1.1. Spectral Analysis
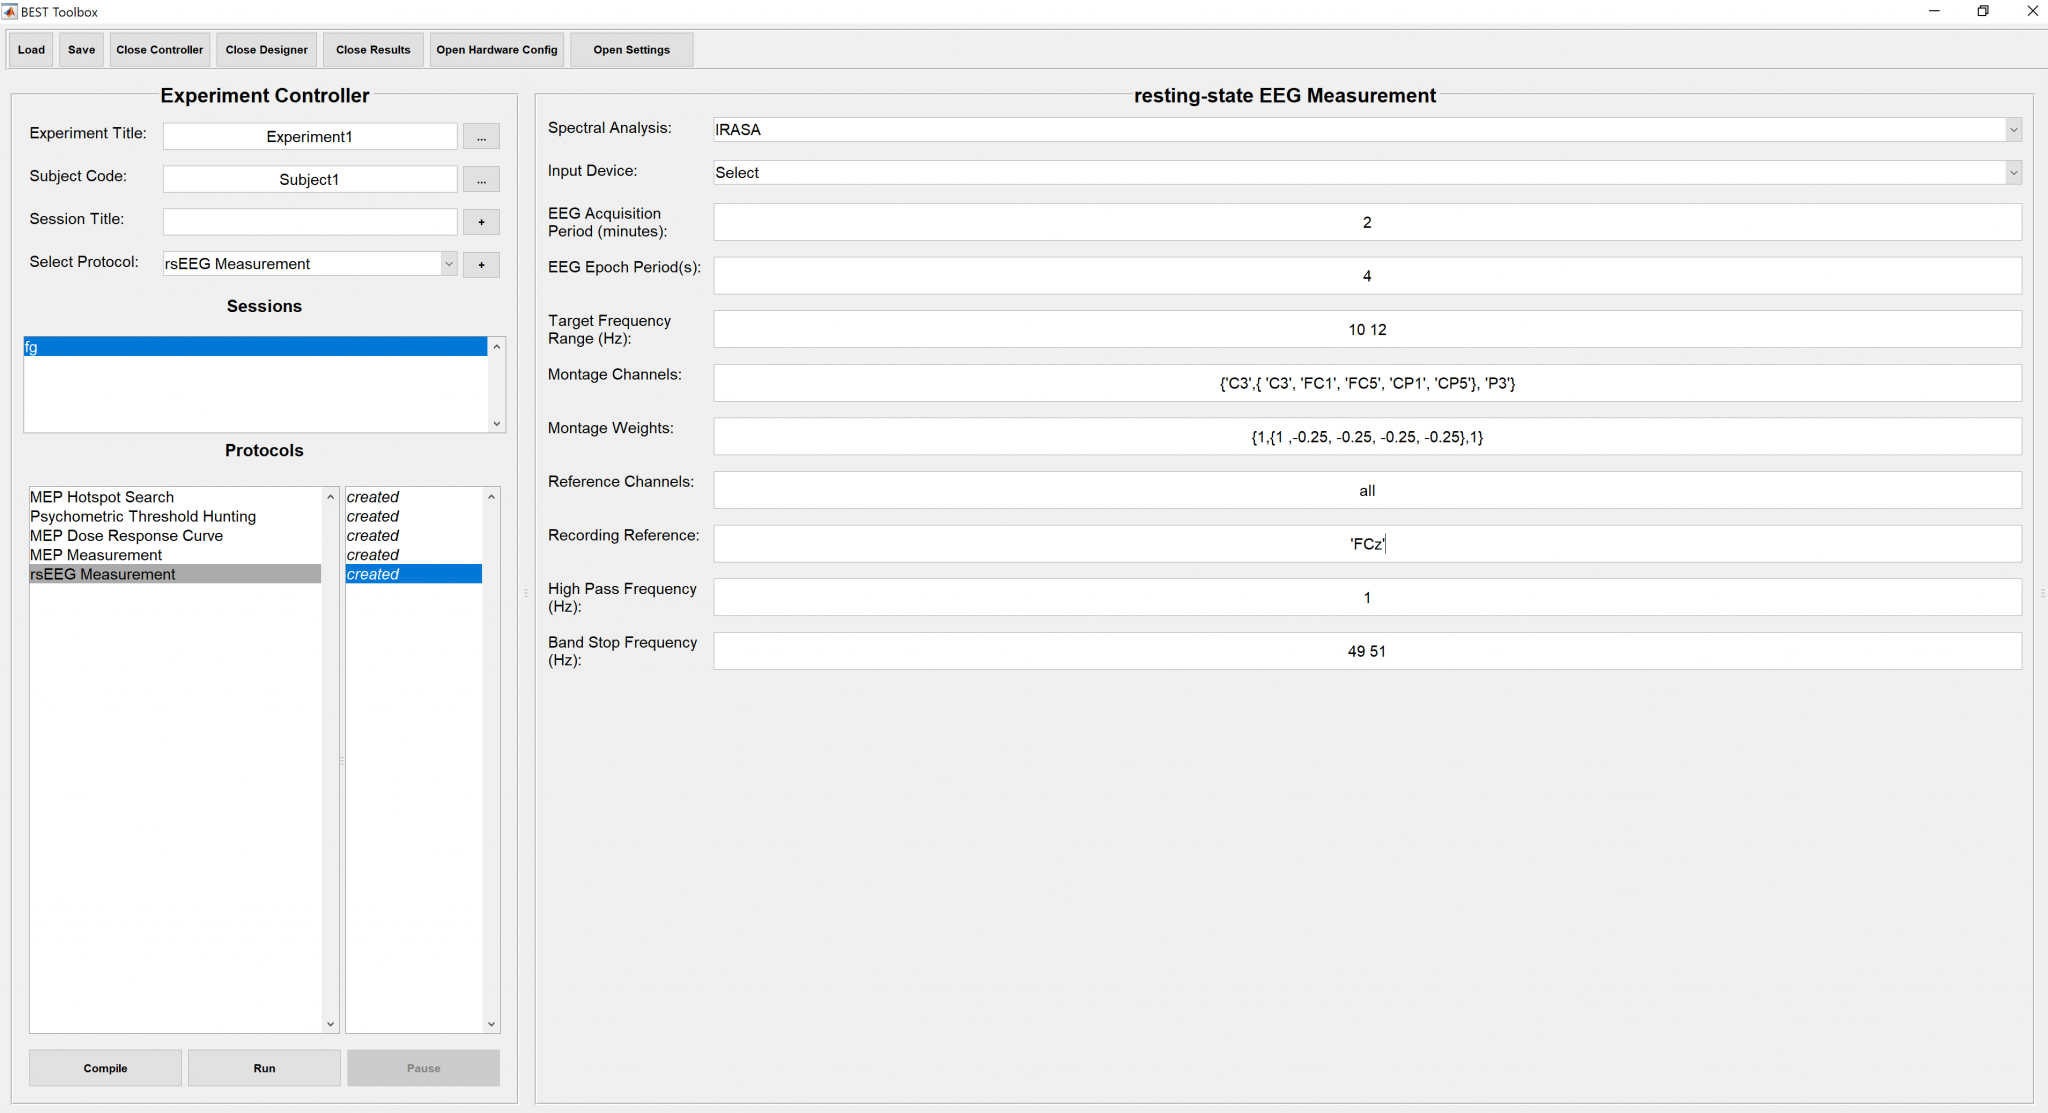
BEST Toolbox has been integrated with FieldTrip’s IRASA and Multi-tapered FFT frequency spectral analysis functions. The choice of one from the two has to be made here using a drop-down.
10.1.2. Input Device
Select the output device using drop down menu from previously added devices
10.1.3. EEG Acquisition Period
The time period in minutes for which the resting state EEG is to be acquired and then the analysis to be applied immediately afterwards with no human involvement so that the Frequency results can be obtained immediately with in a few minutes. Its a scalar data type with units as minutes such as 5, means 5 minutes.
10.1.4. EEG Epoch Period
The continuous data is epoch after acquisition and therefore the length of the epoch has been kept flexible. Its a scalar data type with units in seconds, such as 4.
10.1.5. Target Frequency Range
[min max] in Hz, the individual peak frequency is determined with in this given range of frequency upon estimation of the power spectrum.
10.1.6. Montage Channels
A cell array of strings containing Channel names being streamed, if a Montage has to be created, that is defined as a nested cell array of strings with all channel labels needed in that particular montage. For an instance {‘C3’,{ ‘C3’, ‘FC1’, ‘FC5’, ‘CP1’, ‘CP5’}, ‘P3’} , will provide 3 estimates of Peak Frequency, first one for the C3 channel, second one for the Montage { ‘C3’, ‘FC1’, ‘FC5’, ‘CP1’, ‘CP5’} and third one for the channel P3. See Montage Weights for defining the weights of the montages.
10.1.7. Montage Weights
A cell array of numeric indexed w.r.t to Montage Channels array. If Montage Channels contains a nested cell array, then the same structure would be applied to Montage weights as well with the only difference being the numeric weights instead of the channel names. For the example given in Montage Channels the weights can be {1,{1 ,-0.25, -0.25, -0.25, -0.25},1} , making the montage as Laplacian Hjorth Montage but the first and last channels being the simple ones. Similarly any kind of montage can be defined.
10.1.8. Reference Channels
1xN cell array of channels name (strings) being streamed from the source, no rereferencing is applied if this field is empty and this field can also be ‘all’ for rereferencing against common average of all channels that are being streamed.
10.1.9. Recording Reference
Implicit Reference channel label given as a string such as ‘FCz’, can be empty.
10.1.10. High Pass Frequency
1xN vector of High pass frequency in Hz for data pre processing, no high pass filter is applied if this field is left empty.
10.1.11. Band Stop Frequency
1xN vector of band stop frequencies in Hz for data pre processing, no band pass filter is applied if this field is left empty.
10.2. Starting the Protocol
To start rsEEG Measurement Protocol, just press the “Run” button at the bottom of the “Experiment Controller”. The measurement can be stopped, however unlike other protocols cannot be paused/unpaused because that will cause discontinuities in data and makes the EEG analysis spurious. In order to check if all the parameters have been setup correctly, pressing the “Compile” button would prompt the results of compiled code whether its good to go or not.
An instance of the filled parameters panel is shown below.
